Programs
MWorks Online
Surveys
About MindCul
Contact
+353863679288
PSS 10 Analysis
Home
/
PSS 10 Analysis
PSS 10 Analysis
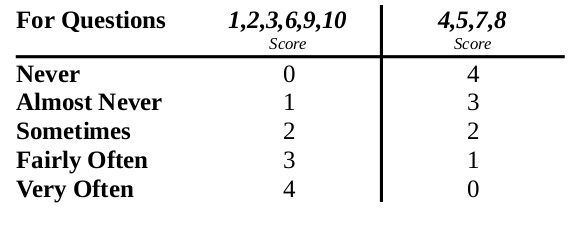
Scoring:
Add all the Scores and Plot on Chart below
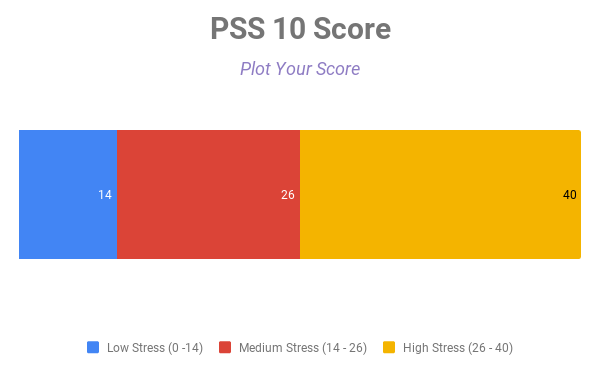
PSS 10 Chart
Your score indicates if you have experienced low, medium or high stress in last month
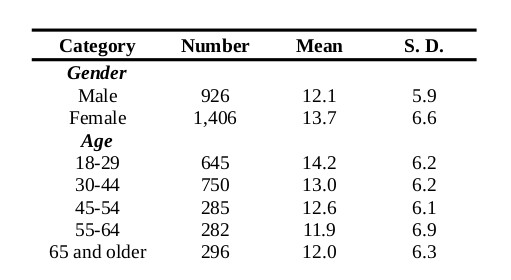
How do you compare? *
* Based on survey of 2,387 respondents in the U.S (1983 Harris Poll)
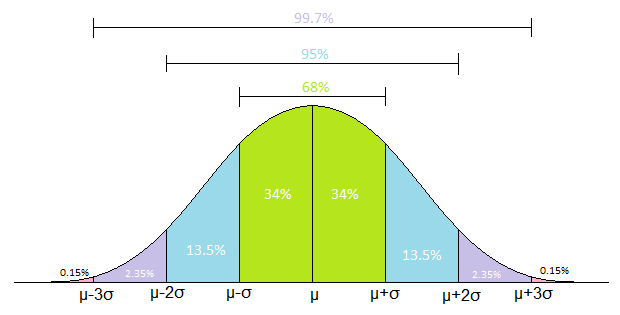
What does Standard Deviation (S.D.) mean?
In a Normal Distribution, 68% of scores are within 1 S.D. of the mean, 95% are 2 S.D. and 99.7% are 3 S.D. of mean
Comments are closed.