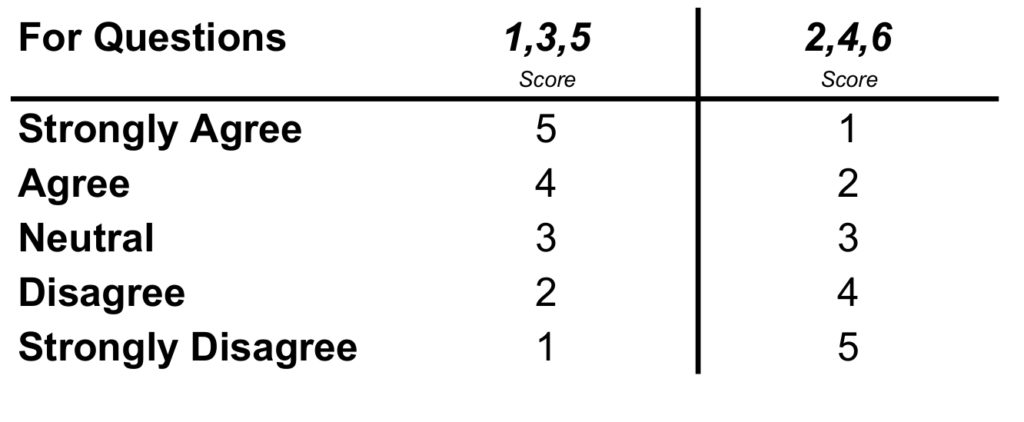
BRS Analysis
Scoring
Plot on the chart below
BRS Chart
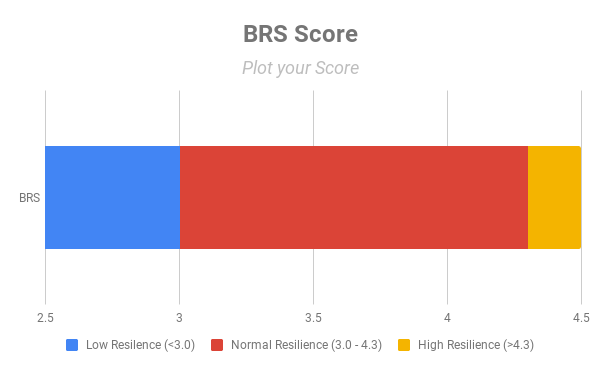
How Do You Compare? *
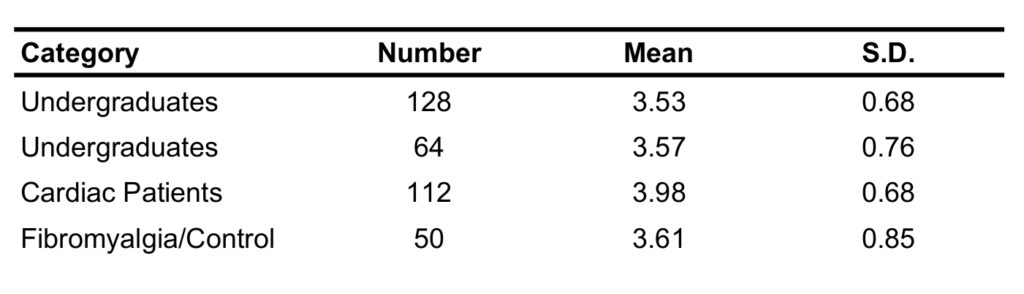
* Smith, B. W., Dalen, J., Wiggins, K., Tooley, E., Christopher, P., & Bernard, J. (2008).
The brief resilience scale: assessing the ability to bounce back. International journal of behavioral medicine, 15(3), 194-200.
What does Standard Deviation (S. D.) mean?
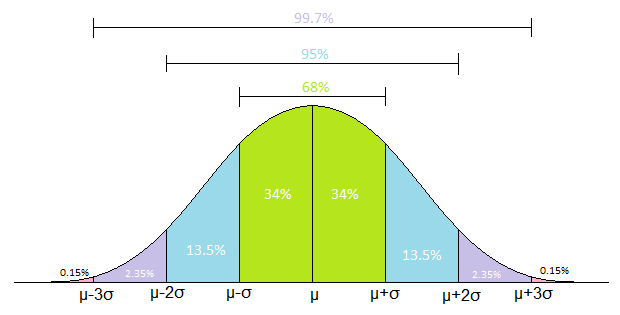
In a Normal Distribution, 68% of scores are within 1 S.D. of the mean, 95% are 2 S.D. and 99.7% are 3 S.D. of mean