CBI Analysis
Scoring
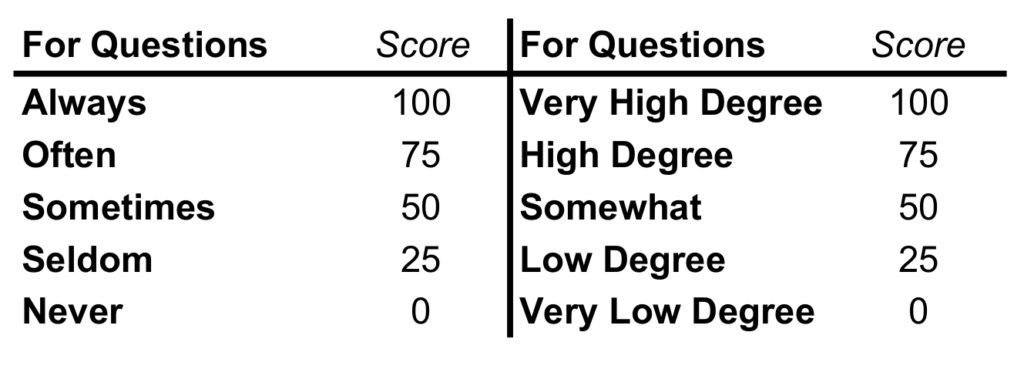
Add all the scores and then divide by the number of questions in each section
(Personal, Work, Client Burnout) to get the Mean for each section.
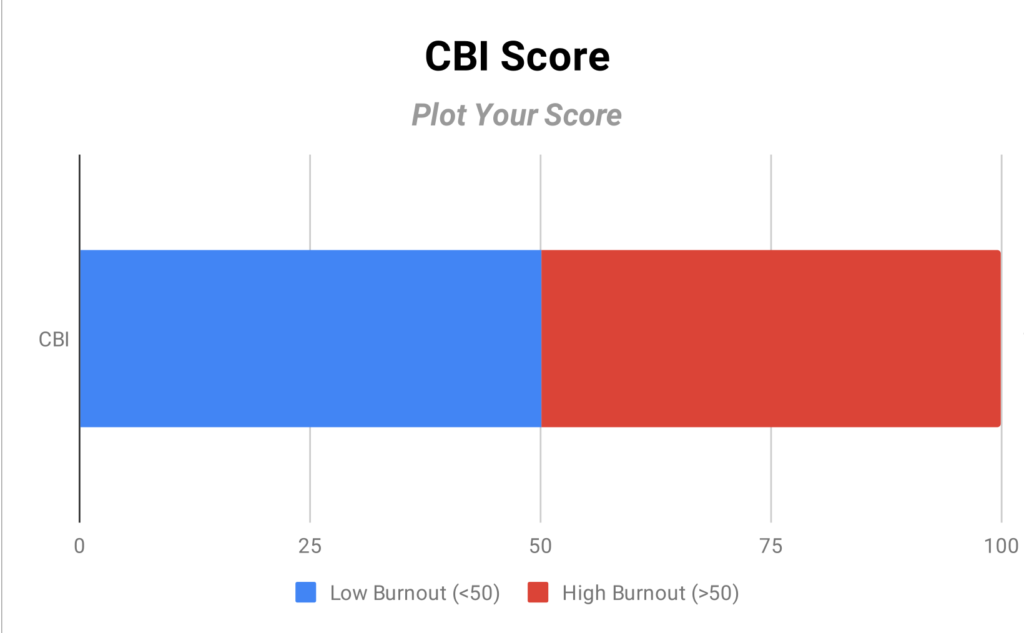
Plot on the chart below
CBI Chart
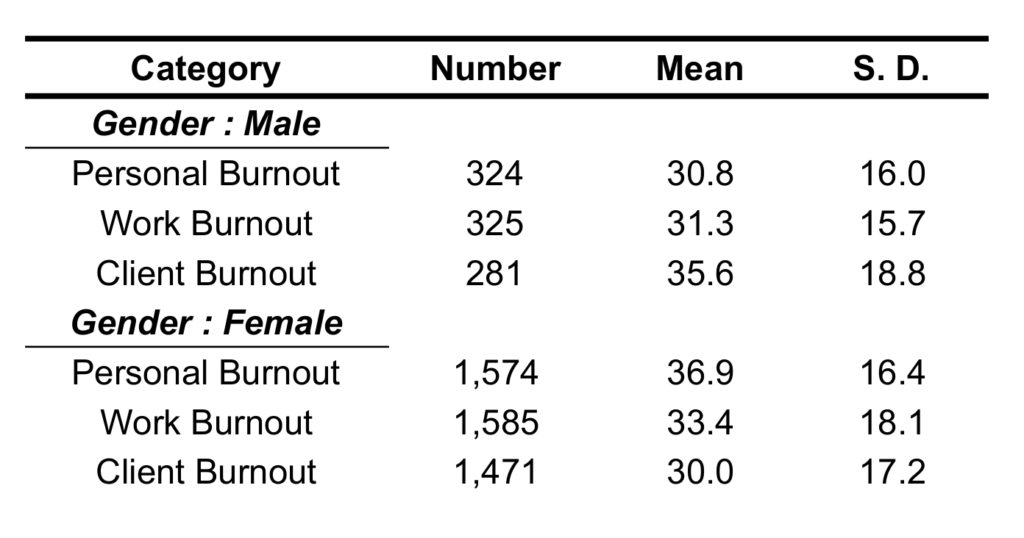
How do you compare? *
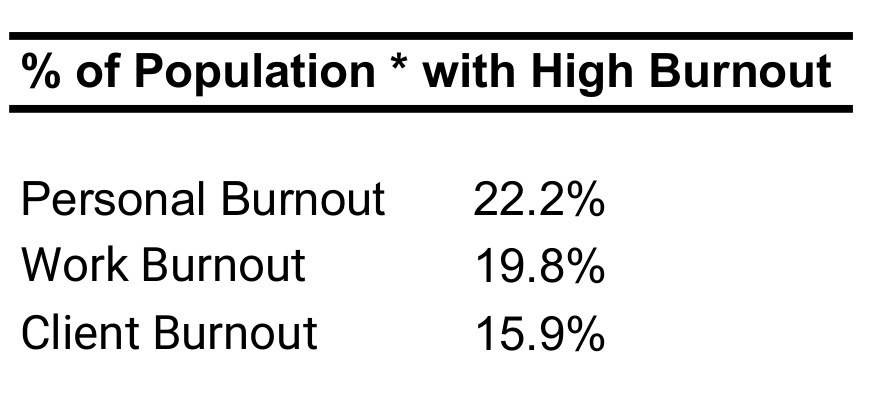
Proportions of the whole PUMA population * with high degree of burnout, defined as 50 points or more:
What does Standard Deviation (S.D.) mean?
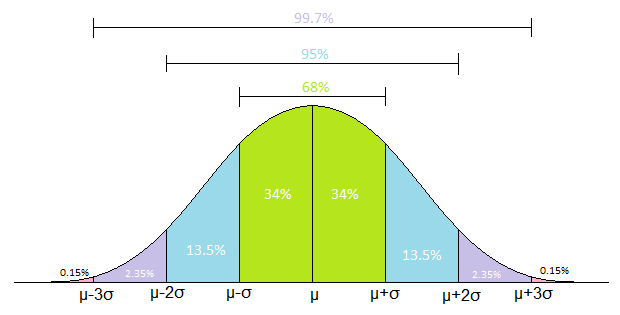
In a Normal Distribution, 68% of scores are within 1 S.D. of the mean, 95% are 2 S.D. and 99.7% are 3 S.D. of mean